A fleet management dashboard is a centralized digital interface that displays real-time data on vehicle location, driver behavior, fuel consumption, maintenance status, and operating costs in one place. For small trucking companies, this single screen replaces scattered spreadsheets, phone calls, and guesswork. Understanding the fleet management dashboard explained in full means knowing which metrics matter, how the interface is built for fast decisions, and how to turn data into lower costs. Fleets that track 15 or more real-time metrics reduce cost-per-mile by 24% and improve vehicle uptime by 31% compared to legacy methods. That gap between data-driven and reactive management is where profit lives.
A fleet dashboard shows the metrics that directly control your operating costs and uptime. The industry term for this category of tool is a telematics dashboard, though fleet management dashboard is the widely used operational term. Either way, the data it surfaces falls into three clear groups.

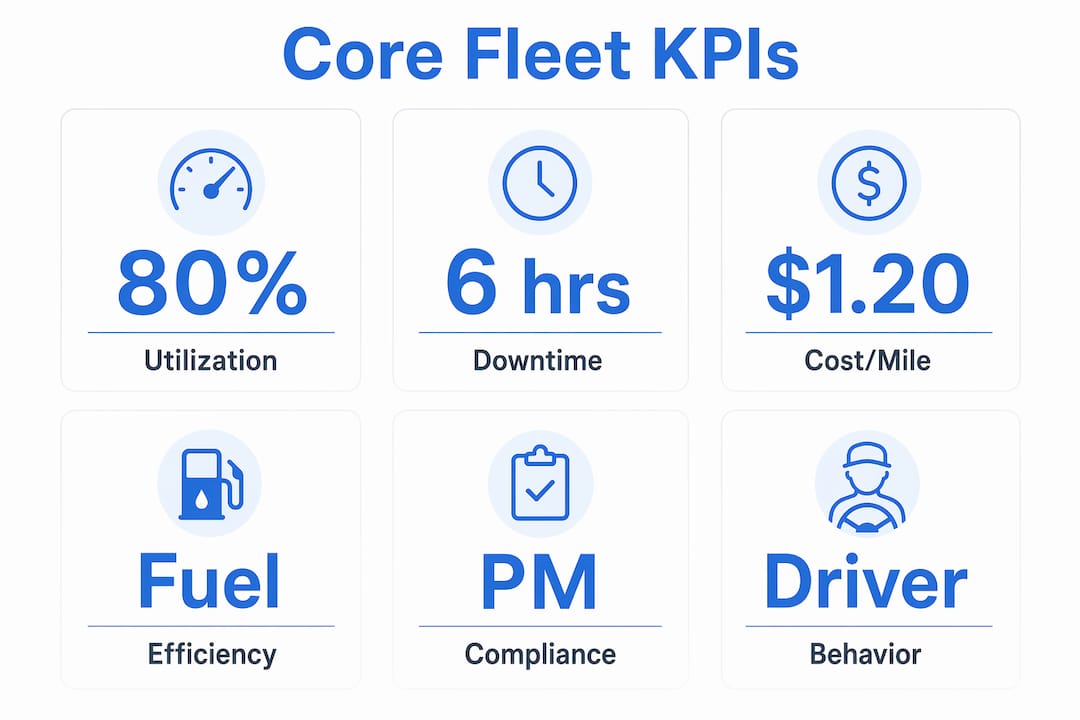
The three most critical performance indicators are vehicle utilization, downtime, and cost per mile. Vehicle utilization measures what percentage of your available fleet hours are generating revenue. Downtime tracks hours lost to mechanical failure or unplanned repairs. Cost per mile is your total operating expense divided by miles driven, and it is the single number that tells you whether your business is profitable on each load.
| Metric | Formula | Benchmark |
|---|---|---|
| Vehicle Utilization | (Active Hours / Available Hours) × 100 | 80%+ |
| Cost Per Mile | Total Operating Cost / Total Miles | Under $1.80 |
| PM Compliance | Completed PMs / Scheduled PMs × 100 | 92%+ |
| Fuel Efficiency | Miles Driven / Gallons Used | Varies by class |
| Driver Safety Score | Weighted events per 1,000 miles | 90+ |
Beyond the core three, fuel efficiency, maintenance compliance, and driver behavior scores fill out a complete picture. Fuel is typically the largest variable cost in trucking, so a 2% drop in miles per gallon across five trucks adds up fast. Driver behavior data, including hard braking, rapid acceleration, and idle time, directly affects both fuel spend and wear on equipment. Maintenance compliance below 92% is a warning sign. PM compliance below 92% should trigger a same-day shop review to prevent costly unplanned downtime.
Pro Tip: Start with five metrics, not twenty. Pick the ones tied directly to your biggest cost categories, get your team comfortable reading them, then add more as your process matures.
Dashboards that pair each metric with a defined action produce measurably better results than those that just display numbers. Action-oriented dashboards drive real operational improvements because every number on screen has a clear owner and a clear response.
Speed to decision is the core benefit of a well-built fleet dashboard. Tiered dashboard design enables users to go from login to identifying critical issues in under 10 seconds. That is not an accident. It is the result of deliberate information architecture.
Most effective fleet dashboards follow a three-tier structure:
This hierarchy prevents information overload. You only drill down when a number at the top level demands attention.
Role-based dashboards give fleet managers, dispatchers, and maintenance technicians customized views tailored to their responsibilities. A dispatcher does not need to see PM compliance history. A maintenance tech does not need load assignment data. When each user sees only what is relevant to their job, response times drop and errors decrease.
Mobile-first design matters here too. A dispatcher managing routes from a tablet needs the same clarity as a manager at a desktop. Platforms built for digital transformation in trucking prioritize responsive layouts that work on any screen size without sacrificing the information hierarchy.
Pro Tip: When evaluating any fleet dashboard, test it on your phone first. If you cannot identify your top three alerts within 10 seconds on a mobile screen, the design will slow you down in the field.
GPS tracking answers one question: where is my truck? A fleet management dashboard answers a different question entirely: how is my fleet performing? Dashboards integrate telematics, maintenance records, driver logs, and cost data into a single operational view. That integration is what separates a passive map from an active management tool.
| Feature | GPS Tracking | Fleet Management Dashboard |
|---|---|---|
| Vehicle location | Yes | Yes |
| Fuel consumption data | No | Yes |
| Driver behavior scoring | No | Yes |
| Maintenance alerts | No | Yes |
| Cost per mile reporting | No | Yes |
| FMCSA compliance logs | No | Yes |
| Custom KPI thresholds | No | Yes |
| Automated reporting | No | Yes |
A basic GPS tool shows you a dot on a map. A full dashboard shows you that the truck in Memphis has a PM overdue, the driver’s idle time is up 18% this week, and the load is running 40 minutes behind schedule. Those three facts together let you make a decision. The dot on the map does not.
Fleet tracking solutions that only provide location data leave money on the table. The real value of fleet data visualization tools comes from connecting location to cost, behavior, and compliance in one view. For small fleets where every dollar counts, that connection is not optional.
Getting a dashboard live is straightforward. Getting your team to use it correctly takes a deliberate process. Follow these steps to build a system that actually changes how you operate.
Define your top five KPIs. Choose metrics directly tied to your biggest cost categories. For most small fleets, that means cost per mile, fuel efficiency, PM compliance, vehicle utilization, and driver safety score.
Set threshold alerts with predefined responses. A threshold without a response is just a notification. Decide in advance what happens when cost per mile exceeds your target or PM compliance drops below 92%. Write it down. Assign an owner.
Configure role-based views for each user type. Your dispatcher needs a different default screen than your shop manager. Set these up before you go live so each person sees relevant data from day one.
Run a two-week baseline period. Before acting on the data, let the system collect enough history to establish your real baseline numbers. Reacting to day-one data before you understand normal patterns leads to bad decisions.
Schedule a weekly 15-minute data review. Automated dashboards save fleet managers 6–10 hours per week by eliminating manual reporting. Use that recovered time for a structured weekly review where your team discusses trends, not just incidents.
Train each role separately. A dispatcher trained on the full dashboard will ignore most of it. Train each user type on their specific view and the two or three actions they are responsible for taking when a threshold fires.
The goal is not to monitor everything. The goal is to act faster on the things that cost you money. Data-driven decisions in small trucking come from simple, repeatable processes built around a small number of well-chosen metrics.
AI-generated insights are also changing how dashboards surface priorities. Breakdown risk scoring and AI-driven recommendations now help fleet managers prioritize maintenance and safety efforts before a problem becomes a breakdown. This moves fleet management from reactive to genuinely predictive.
A fleet management dashboard only delivers ROI when each metric is paired with a predefined action and owned by a specific person on your team.
| Point | Details |
|---|---|
| Dashboards beat GPS tracking | Full dashboards integrate cost, behavior, and compliance data that location tools cannot provide. |
| Metrics need owners and actions | Thresholds without predefined responses waste the investment in dashboard technology. |
| Role-based views speed up decisions | Customized views for managers, dispatchers, and techs cut noise and reduce response time. |
| Start small, then expand | Begin with five core KPIs and add metrics only after your team builds consistent habits. |
| Automation saves real time | Automated dashboards eliminate 6–10 hours of manual reporting per week for fleet managers. |
I have worked with enough small trucking operations to spot the pattern immediately. The owner invests in a dashboard, the team gets a login, and within 60 days the tool becomes a map with extra steps. Nobody set up threshold responses. Nobody assigned metric ownership. The dashboard displays data, and the data sits there.
The uncomfortable truth is that a dashboard that merely displays data wastes screen space. The real value is in the response layer, the part most small fleets skip entirely. When PM compliance drops below 92%, someone needs to walk into the shop that same day. When cost per mile spikes on a specific truck, someone needs to pull the maintenance history before the next dispatch. Without that layer, you have paid for a very expensive notification system.
The other mistake I see is trying to track everything at once. Twenty metrics on day one guarantees that your team tracks nothing with discipline. Pick five. Build the habit. Then grow.
The future of fleet dashboards is moving toward AI-driven recommendations that do not just flag thresholds but tell you which three trucks to prioritize this week and why. That shift from alert to recommendation is significant. It means the dashboard becomes a decision support tool, not just a reporting tool. Small fleets that build good data habits now will get far more value from that next generation of tools than those starting from scratch.
Embrace the technology confidently. The learning curve is shorter than you think, and the payoff in fleet maintenance cost savings shows up within the first quarter.
— Managment
Goeldhub is built specifically for small and mid-sized trucking companies that need real operational control without enterprise-level complexity or cost.
At $15 per driver per month, Goeldhub gives you FMCSA-compliant ELD services, driver log management, fuel card programs, and low-fee factoring, all in one platform. If you are ready to pair your dashboard data with qualified drivers, explore CDL driver staffing solutions that keep your seats filled and your trucks moving. For cash flow support between loads, Goeldhub’s factoring services give you fast access to freight revenue without the typical high fees. Start with a 14-day free trial and see how clean data and the right support team change how you run your fleet.
A fleet management dashboard is a centralized digital interface that displays real-time data on vehicle location, fuel use, driver behavior, maintenance status, and operating costs. It gives fleet managers a single view to monitor performance and make faster operational decisions.
GPS tracking shows where your vehicles are. A fleet dashboard integrates location data with cost, compliance, maintenance, and driver behavior data to answer how your fleet is performing, not just where it is.
Start with cost per mile, vehicle utilization, PM compliance, fuel efficiency, and driver safety score. These five metrics cover the largest cost categories and give you the clearest picture of operational health.
Automated fleet dashboards eliminate 6–10 hours of manual reporting per week for fleet managers by generating custom reports and firing alerts automatically.
Yes. Small fleets benefit most from dashboards because every truck and every dollar matters more at smaller scale. Role-based views and simple KPI setups make dashboards practical even for a three-truck operation.


